


NIFE
AI-Powered 3D Visualization for Real-Time Autonomous Mission Monitoring
Project Overview
A Real-Time 3D Visualization Platform for Smarter Autonomous Mission Operations
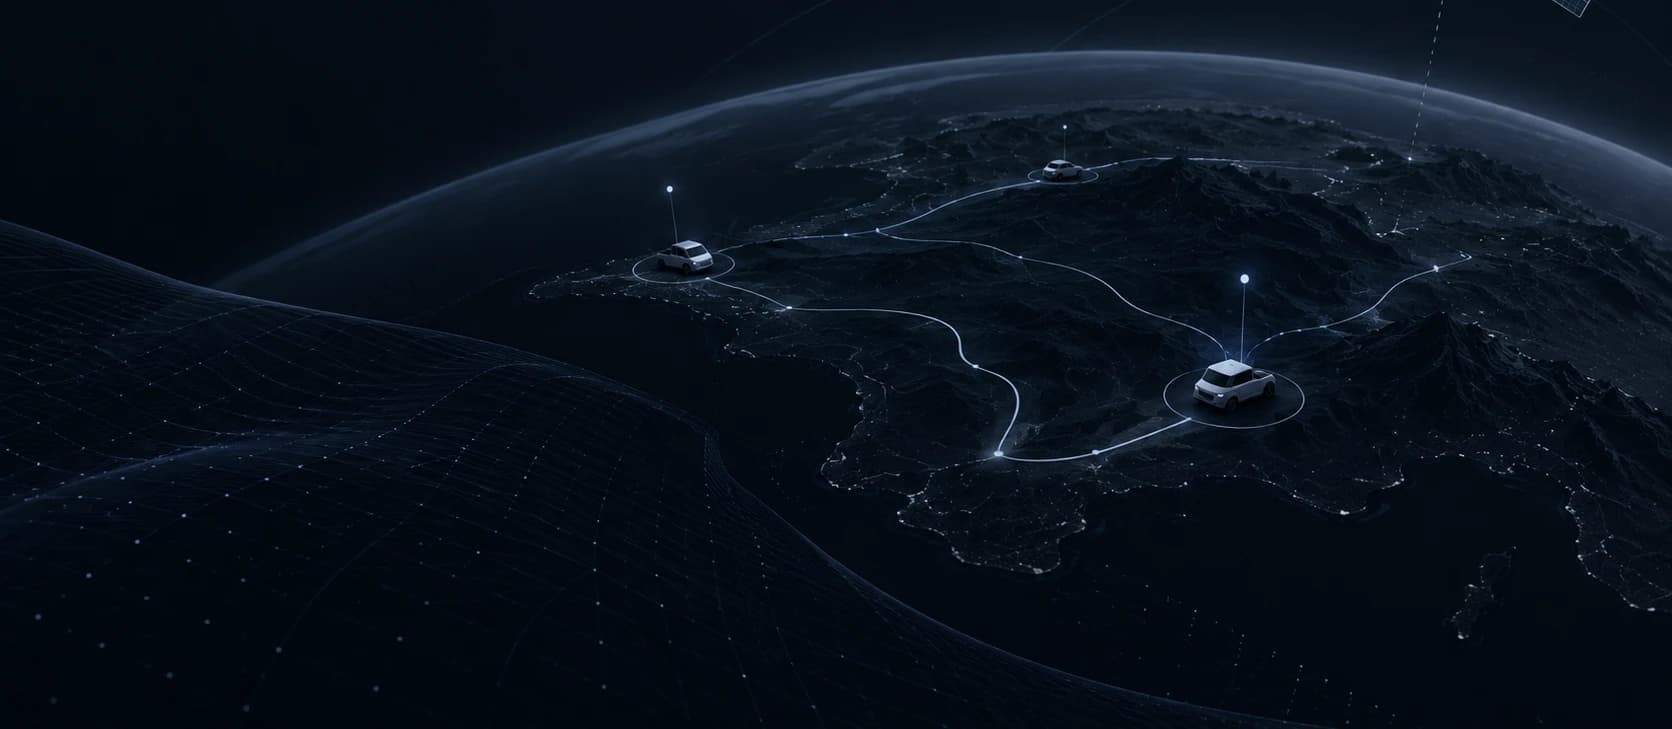
NIFE is a real-time 3D visualization platform for autonomous mission operations, giving operators live visibility into asset positions, navigation paths, and mission data. It integrates ROS telemetry with interactive 3D maps, enabling real-time vehicle tracking, multi-vehicle monitoring, route comparison, and historical mission analysis through a browser-based interface.
Product Type
3D Visualization Platform
Platform
Browser-Based
Domain
Autonomous Vehicles
The Challenge
Making Real-Time Vehicle Data Actionable Through Smarter 3D Visualization
Complex Telemetry Data
Large volumes of real-time telemetry made vehicle information difficult for operators to interpret efficiently.
Low-Latency Visualization
High-frequency data required responsive, near real-time 3D-visualisation.
Complex 3D Representation
Vehicle positions and navigation routes needed accurate representation within a 3D environment.
ROS Data Integration
The platform needed to work seamlessly with ROS telemetry streams.
Live & Historical Visibility
Operators needed access to both current vehicle activity and historical mission data.
Project Objective
Building a Real-Time Vehicle Tracking System for Clearer Fleet Operations
Simplify Complex Telemetry
Build a browser-based interface that turns dense, high-frequency telemetry into responsive 3D visualization operators can read at a glance.
Provide Real-Time Vehicle & Route Visibility
Give operators real-time vehicle and route visibility, integrated directly with live ROS data.
Support Live & Historical Mission Monitoring
Give operators the ability to monitor missions as they happen and review historical mission data after the fact.
The Solution
Bringing 3D Maps, Live Telemetry, and Mission Data Into One Operational View
Interactive 3D Visualization
Transformed vehicle locations, routes, and mission data into an interactive 3D environment.
Live Telemetry Monitoring
Integrated ROS telemetry streams to provide real-time visibility into vehicle movement and operational status.
Route & Mission Visualization
Enabled comparison of planned routes with actual movement and supported historical mission replay.
Unified Fleet Monitoring
Brought multiple autonomous vehicles into a single operator interface for centralized monitoring.
Browser-Based Operations
Delivered an accessible web interface designed for efficient monitoring and operational awareness.
Our Contribution
Enabling Real-Time Vehicle Tracking Through Reliable 3D Visualization
We worked closely with the NIFE team across development, iteration, and ongoing support to deliver a reliable, responsive 3D visualization platform.
From development to deployment, our focus stayed on building a robust, intuitive platform for real-world autonomous vehicle operations.
Fast-Paced Execution
Completed assigned development tasks within planned timelines, helping maintain momentum across the project.
Real-Time Visualization Support
Contributed to implementing the telemetry system and real-time vehicle data within the visualization experience.
Weekly Demonstrations & Feedback
Demonstrated working progress every Friday and incorporated feedback into subsequent iterations.
Technical Collaboration
Supported real-time vehicle tracking, route visualization, and multi-vehicle monitoring while collaborating closely throughout development.
Continuous Project Support
Provided ongoing technical support and timely assistance to keep development moving efficiently.
Technical Architecture & Implementation
Built for real-time autonomous fleet operations, combining live telemetry, 3D geospatial visualization, and scalable backend infrastructure.
01 — Real-Time Telemetry Pipeline
Eclipse Zenoh delivers live fleet telemetry through a pub/sub architecture, with Protocol Buffers defining the data contract and Redux Toolkit connecting the stream to the browser.
02 — 3D Geospatial Visualization
CesiumJS and Resium render asset positions, planned routes, sensor coverage, and operational zones on a 3D globe with MIL-STD-2525 symbology and MGRS/geodetic coordinate handling.
03 — Reactive State & Mission Management
Redux Toolkit manages continuously changing fleet, mission, and execution data across 52 state domains using strict-mode TypeScript for responsive operations.
04 — Backend & Spatial Data Layer
Python/FastAPI with PostgreSQL and PostGIS handles persistence, event streams, audit history, and mission plans through a structured backend service.
05 — Quality & Scalable Development
Vitest, Testing Library, Cypress, Biome, and Husky support automated testing, type safety, and quality checks, while Vite enables incremental development around evolving telemetry and rendering requirements
Key Capabilities
Smarter Vehicle Tracking Through 3D Visualization and Telemetry Monitoring
Interactive 3D Globe Visualization
Displays vehicle positions, planned routes, and spatial data within an interactive 3D environment for clear situational awareness.
Live Telemetry Monitoring
Provides up-to-date vehicle state, heading, and sensor information from live telemetry streams.
Planned Path Visualization
Visualizes planned navigation routes alongside actual vehicle movement for route comparison.
Historical Mission Replay
Enables operators to review previous missions, examine vehicle journeys, and analyze past routes or anomalies.
Multi-Vehicle Monitoring
Supports simultaneous monitoring of multiple autonomous vehicles through a responsive operator interface.
Accessible Browser-Based Interface
Provides a polished, operator-focused interface designed for efficient interaction with complex vehicle and mission data.
TESTIMONIAL
We've been working with NeuraDynamics on UI execution and early-stage product development, and the experience has been very strong. The team brings solid technical depth, moves quickly, and is proactive about taking on work rather than waiting to be directed. Communication has been fast, clear, and reliable, which has made coordination easy across time zones.
What stands out most is their delivery discipline: they test their work, focus on quality, and don't "throw code over the fence." They take ownership of outcomes and are thoughtful about integration and correctness. Invoicing has been transparent and honest, and expectations are set clearly upfront.
Overall, NeuraDynamics has been a productive, dependable partner, and we've been very happy with both the speed and quality of their execution.
— Apu Sharma
Head of Engineering, NIFE
Get Started
Bring Real-Time Visibility to Your Fleet Operations
Connect with "Neura Dynamics" to explore 3D visualization and telemetry solutions that give your operators clear, real-time and historical visibility into autonomous vehicle operations.
Talk to Our Experts